Win Probability
The concept of win probability is not new. The idea is to build a model which predicts the likelihood that a particular team will eventually go on to win a match
Sabermetricians in the US have used them in baseball (e.g. Fangraphs) for a long time, and many people before me have built similar models for cricket. My first exposure to the idea was in around 2007 with the NFL. Brian Burke built win probability models for his website Advanced NFL Analytics - and the approach that I take for T20 is still influenced heavily by the methods he used

Properly constructed, win probability models can be a powerful tool. Cricket is a statistic-rich game and all fans are familiar with batting averages, bowling average, strike rates and economy. But these statistics have their deficiencies, mainly because they a agnostic to the match situation. Most obviously, the strike rate of batsmen in the latter overs of a T20 innings are expected to be higher than those during the middle overs and comparing the two is ill-founded. Changes in win probability, however, are designed to be sensitive to situation. Furthermore, changes in win probability have a constant value... a 10% improvement in win probability is just as valuable at the start of the games as it is at the end
The sister to win probability is expected runs. In the same way that we can estimate the chance a team will win, we can also predict the total number of runs they will score. And again, we can look at how the expected run total changes from ball to ball to understand how impactful specific events are during a match. As with win probability, changes in the expected run total are sensitive to the match situation. But they do not have the 'constant value' property; that an extra 6 runs is equally valuable throughout a given game. For example, an additional one run added to the total of the team batting first is often more valuable than an addition 10 runs in a chase that is already far out of reach
Using LOESS to tame the complexity of cricket
The rules of cricket can be complicated. Unlike almost any other sport, there is no obvious way to decide who is winning during a match, with commentators left to pontificate over what might make a good score on a particular pitch and under particular weather conditions. Even just understanding the score is not trivial - you need to consider the number of overs left, the number of wickets left, and the number of runs already scored, and the target set by team that batted first (if in the second innings)
My first step was to estimate win probability based on three variables:
- Balls remaining in the match - ranging from 0 to 240
- Wickets lost by team currently batting - ranging from 0 to 9
- Run rate - current run rate if in the first innings and the required run rate if in the second innings - happily these two metrics are equal at the crossover between innings
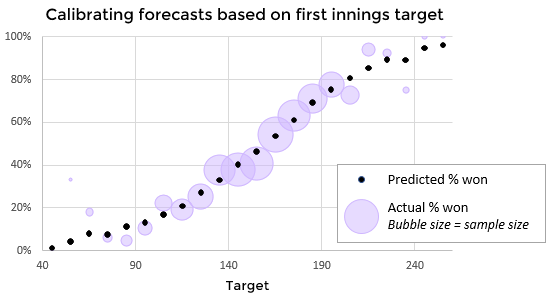
Effectively what we are attempting to do is say, "on average 56% of teams with 5 wickets in hand, with 30 balls remaining, and chasing a required run rate of 8.10 go on to win the match". Unfortunately, in the historical data that I have available, only three matches involved that exact situation - clearly not a large enough sample to estimate such a precise probability
To solve this, we use a statistical technique called LOESS which takes into account other nearby data points in order to produce an estimate. It is used as a smoothing technique, to create a smooth curve through what is otherwise noisy data

The completed win probability model uses several different LOESS regressions to produce a final estimate of win probability. I built similar models to predict the run rate and therefore also the expected run total for each innings

One interesting application of the expected run total model is to understand the value of a wicket. We can look at the total predicted by the model immediately before and after the fall of a wicket to see the overall impact. On average, a wicket is worth about 5.5 runs but this varies considerable depending on which wicket is falling. And the pattern is different between the first and second innings
Some of the run value from a fallen wicker is from the advantage of having less skilled batsmen at the crease. The reason that top order wickets are so valuable in the first innings is that these players are more able to play aggressively and score quickly while setting a total. The rest of the value is related to bating the full 20 overs. The reason that the last batsman in the second innings is worth 7.3 runs is that this is how many we expect the last pairing to score before they lose that final wicket
Adjusting for venue and conditions
A big challenge for a model built in this way is to correctly assess a match during the first innings. With different venues and different playing conditions from day to day, it is hard to differentiate between a team batting well on bad pitch and a team batting poorly on a good one. The result is that the model is fairly conservative in the first innings and is reluctant to chose a strong favourite to win the match
I have a second model which uses home advantage, winning the toss, and past matches at the venue to predict the outcome of a match between innings, at the point when the target is set but the chase has not yet begun. This model can then be used to reverse-engineer a par score and combined with the expected run total model to understand how well teams are faring throughout the match
My expectation was that this second model would perform better than the more general win probability model during the first innings, when uncertainty about the pitch and conditions are higher. However, once the target is set and the other team has the chase well under way, I would expect it to perform less well than the model which explicitly accounts for the number of remaining wickets and overs
Evaluating the models' accuracy
So how do we decide how well the model is performing? I like to use the Brier score. There are other ways to measure the accuracy of a forecast but one of the advantages of the Brier score is that it can be neatly broken down into constituent components
The first component, uncertainty, measures the inherent uncertainty in the event. Cricket matches are designed to be fair contests where both teams have an equal chance of winning (as opposed to events where one outcome is more likely than the other). This means that the uncertainty for T20 cricket matches is the maximum possible value: 0.25
The second component, resolution, measures the confidence of the model that a particular outcome will occur. When the model thinks that one team has a 90% chance of winning, then it is more confident than when it gives both teams a 50% chance (e.g. at the start of the match). Satisfyingly, the first win probability model has low confidence during the entire first innings and only really starts to pick a winner during the chase. The second model is slightly more confident at the changeover between innings and then performs much worse in the second innings

The third component, reliability, measures the calibration of the model. When the model estimates an 80% chance of winning then we want it to be 'correct' exactly 80% of the time. It is just as important for the model to sometimes be 'wrong' as it is for it be 'correct' most of the time - otherwise the model is being overconfident. Upsets happen, and the model should give probabilities which reflect the chance of an upset happening
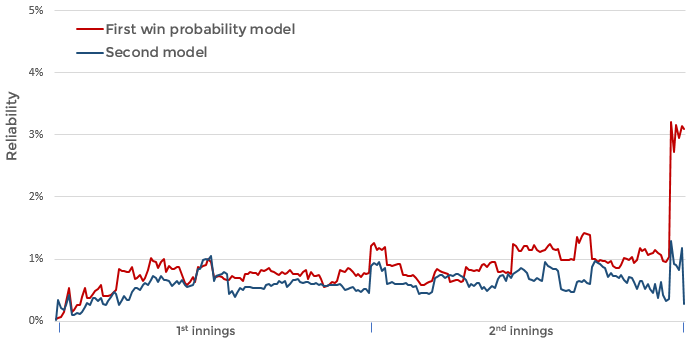
Both models are well calibrated (low score is better). But both models do worse in the death overs of the second innings. This is when very particular circumstances can have an impact on the outcome, such as which batsman is facing or the likelihood of a tie, and so it is not surprising that the models fare less well here
Although the second model seems more reliable in the second innings, this is because the model is not making high resolution predictions - i.e. it is not 'sticking it's neck out' to pick an outcome with any confidence. We could create a perfectly reliable model by always predicting a 50:50 contest but this wouldn't be particularly useful

The best results are produced by combining the two models to take full advantage of their individual strengths. The first model is given more weight during the second innings, whilst the second model is given more weight near the changeover. The purple line shows the composed Brier scores (Uncertainty - Resolution + Reliability) for the combined model; low scores are better
Final notes about the model
The Achilles heel of the win probability model is close matches at the death. The estimates are not totally crazy but if the model were setting odds then it wouldn't take a prodigiously talented punter to win money from it. When focusing on the death overs, I tend to ignore these models entirely and manually find historical match situations to help my analysis. I am also working on a simulation model to use in the last few overs which should do a much better job
Something that I haven't mentioned is the potential of a tied match. A tie occurs just over 1% of the time in my data which is not quite enough data to build anything particularly sophisticated. The final model incorporates a bit of a fudge to cover the eventuality of a tie. A simulation-type model, again, could help here
I have completely ignored matches decided by the Duckworth-Lewis method or matches cancelled by rain. I may get around to tackling this challenge one day but, for now, my models are practically useless once weather starts impacting the outcome of a match